Contents
clc;
clear;
close all;
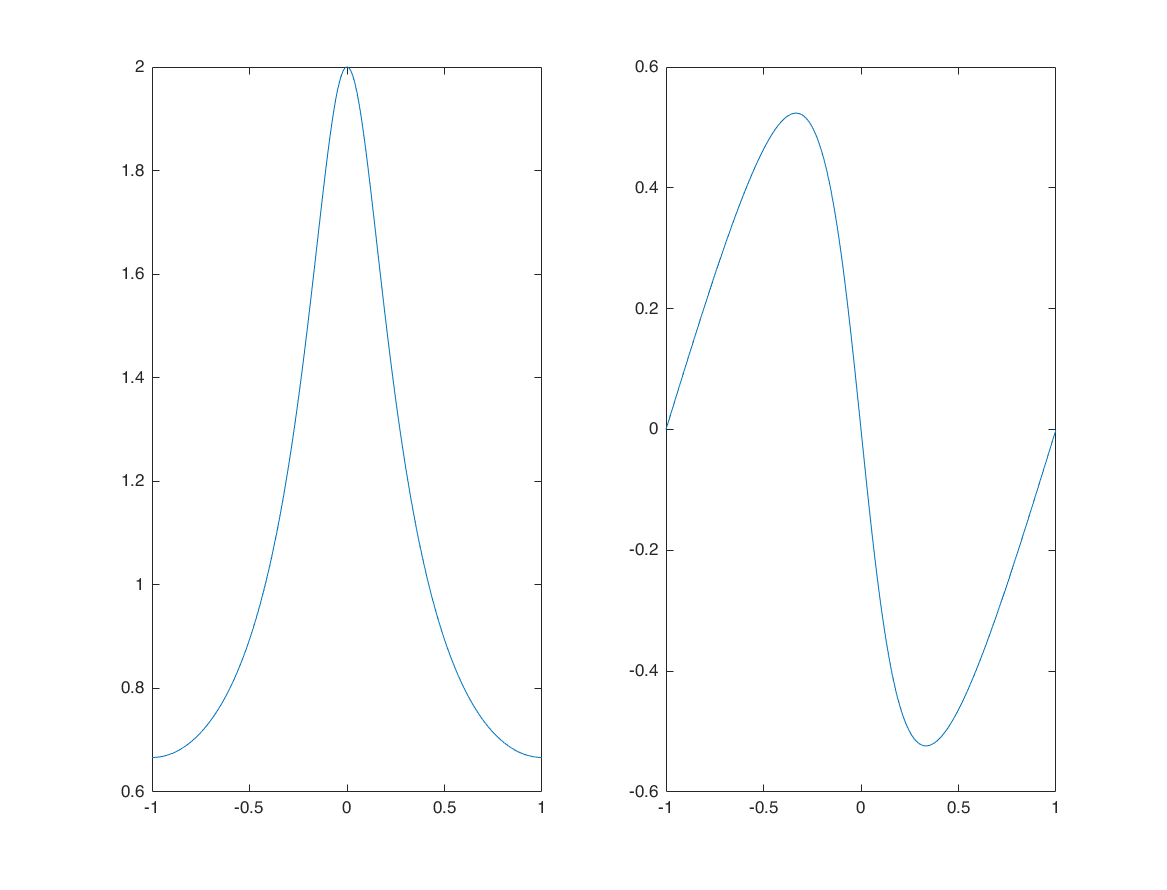
recusrive low-pass filter
y(n) = 0.5*y(n-1) + x(n)
o = -pi:0.01:pi;
H = 1./(1-0.5*exp(-1i*o));
figure
subplot(1,2,1);
plot(o/pi,abs(H))
subplot(1,2,2)
plot(o/pi,unwrap(angle(H)))
fdatools
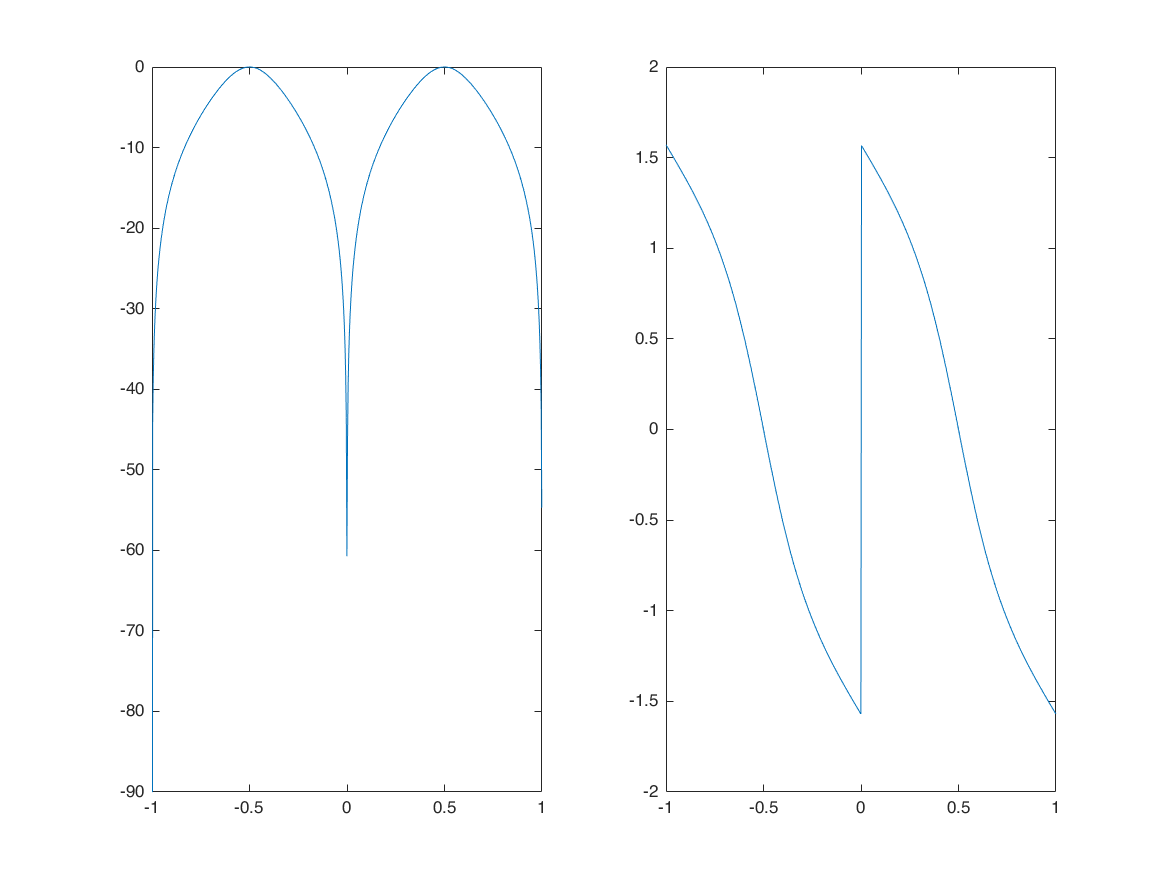
o = -pi:0.01:pi;
H = (sqrt(3)-1)/2*(exp(1i*o*2)-1)./(exp(1i*o*2)+2-sqrt(3));
figure
subplot(1,2,1);
plot(o/pi,20*log10(abs(H))); ylim([-90,0])
subplot(1,2,2)
plot(o/pi,unwrap(angle(H)))

% question: design this with <fdatools>

NUM = [0.366000000000000 + 0.00000000000000i, ...
    0.00000000000000 - 4.48220728487931e-17i, ...
    -0.366000000000000 + 4.48220728487931e-17i];

DEN = [1.00000000000000 + 0.00000000000000i, ...
    -6.33877183238670e-17 + 1.11022302462516e-16i, ...
    0.267909760000000 + 0.00000000000000i];
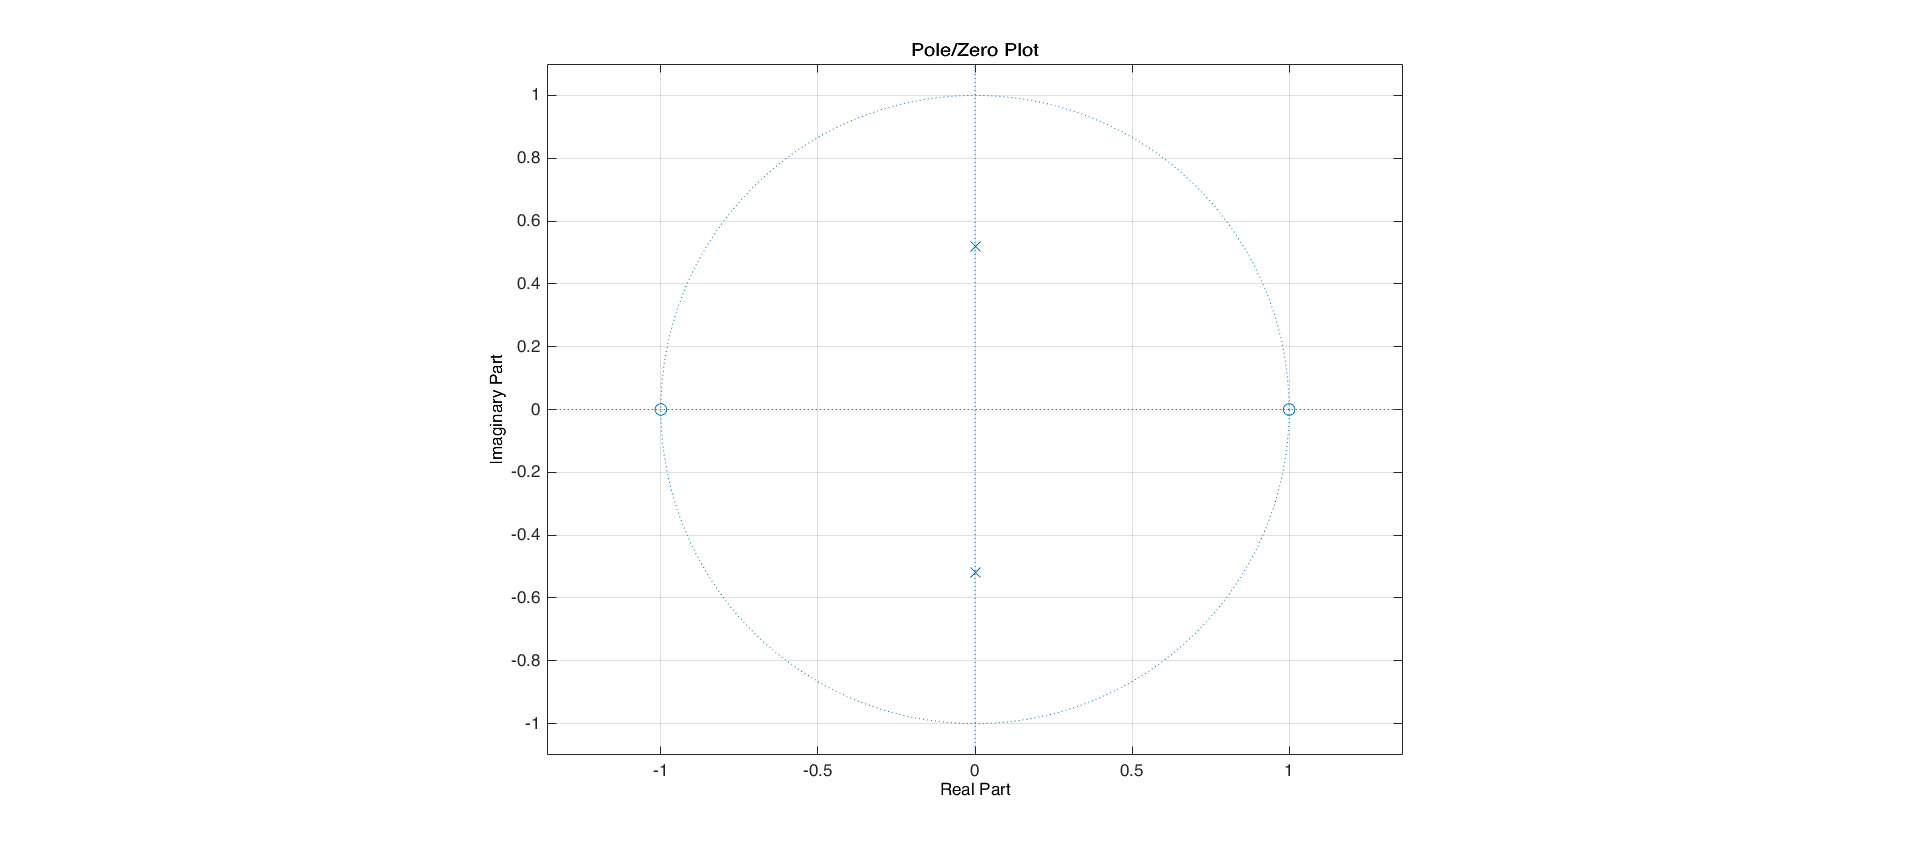
tf2zp, zp2tf
[z,p,k] = tf2zp(NUM, DEN);
[b,a] = zp2tf(z,p,k);
fvtool
fvtool(b,a,'polezero')
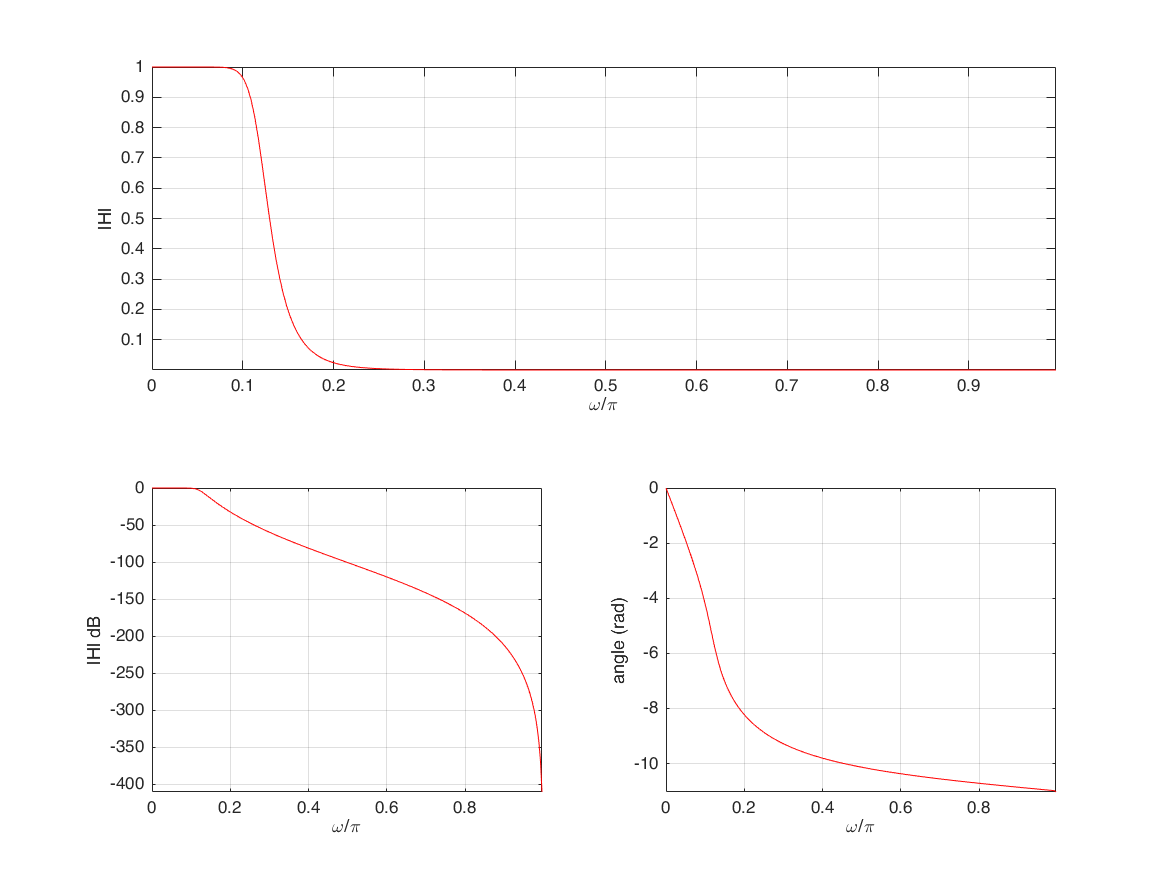
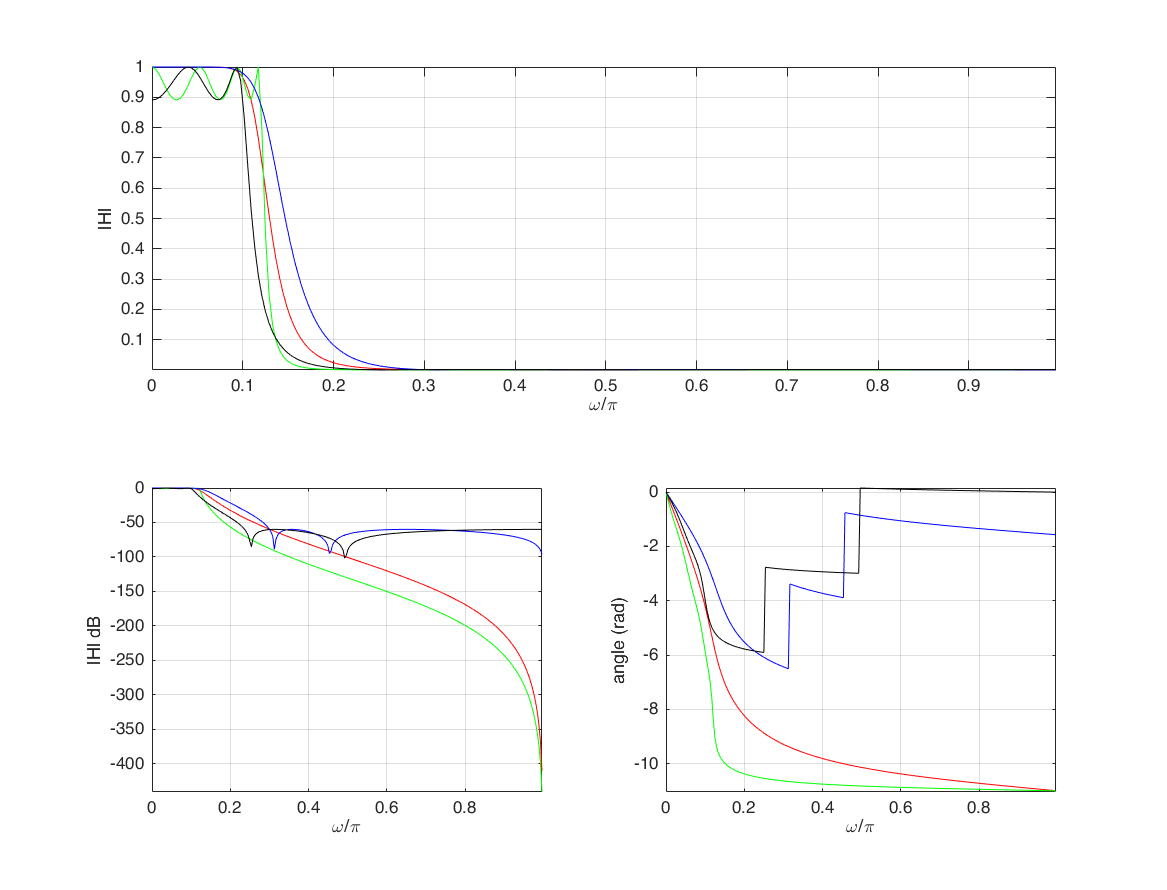
butterworth filter
[b,a] = butter(7, 0.12);
[H,W] = freqz(b,a,256);

figure
subplot(2,2,[1,2])
plot(W/pi,abs(H),'r'); xlabel('\omega/\pi'); ylabel('|H|'); grid on; axis tight; hold on;
subplot(2,2,3)
plot(W/pi,20*log10(abs(H)),'r'); xlabel('\omega/\pi'); ylabel('|H| dB'); grid on; axis tight; hold on;
subplot(2,2,4)
plot(W/pi, unwrap(angle(H)),'r'); xlabel('\omega/\pi'); ylabel('angle (rad)'); grid on; axis tight; hold on;
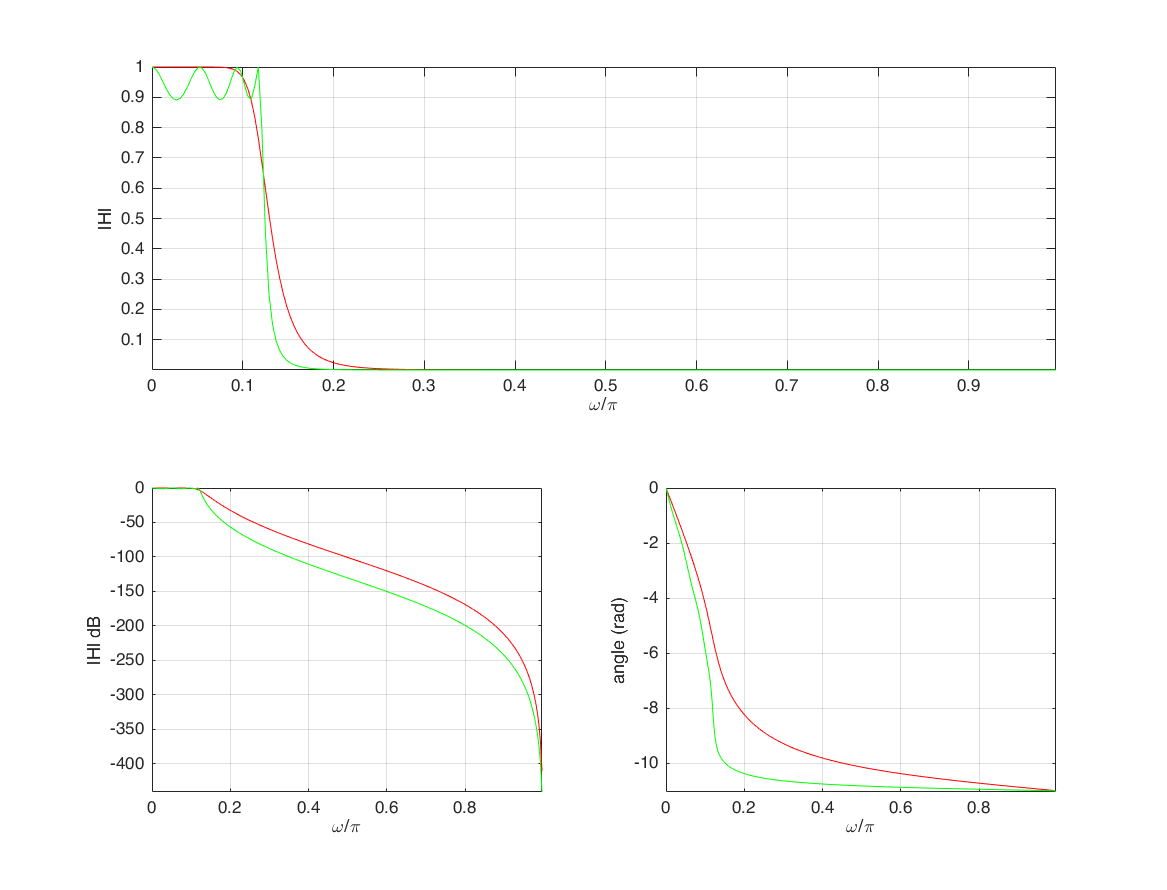
Chebyshev Type I
[b,a] = cheby1(7, 1, 0.12);
[H2,W] = freqz(b,a,256);

subplot(2,2,[1,2])
plot(W/pi,abs(H2),'g'); xlabel('\omega/\pi'); ylabel('|H|'); grid on; axis tight;
subplot(2,2,3)
plot(W/pi,20*log10(abs(H2)),'g'); xlabel('\omega/\pi'); ylabel('|H| dB'); grid on; axis tight;
subplot(2,2,4)
plot(W/pi, unwrap(angle(H2)),'g'); xlabel('\omega/\pi'); ylabel('angle (rad)'); grid on; axis tight;
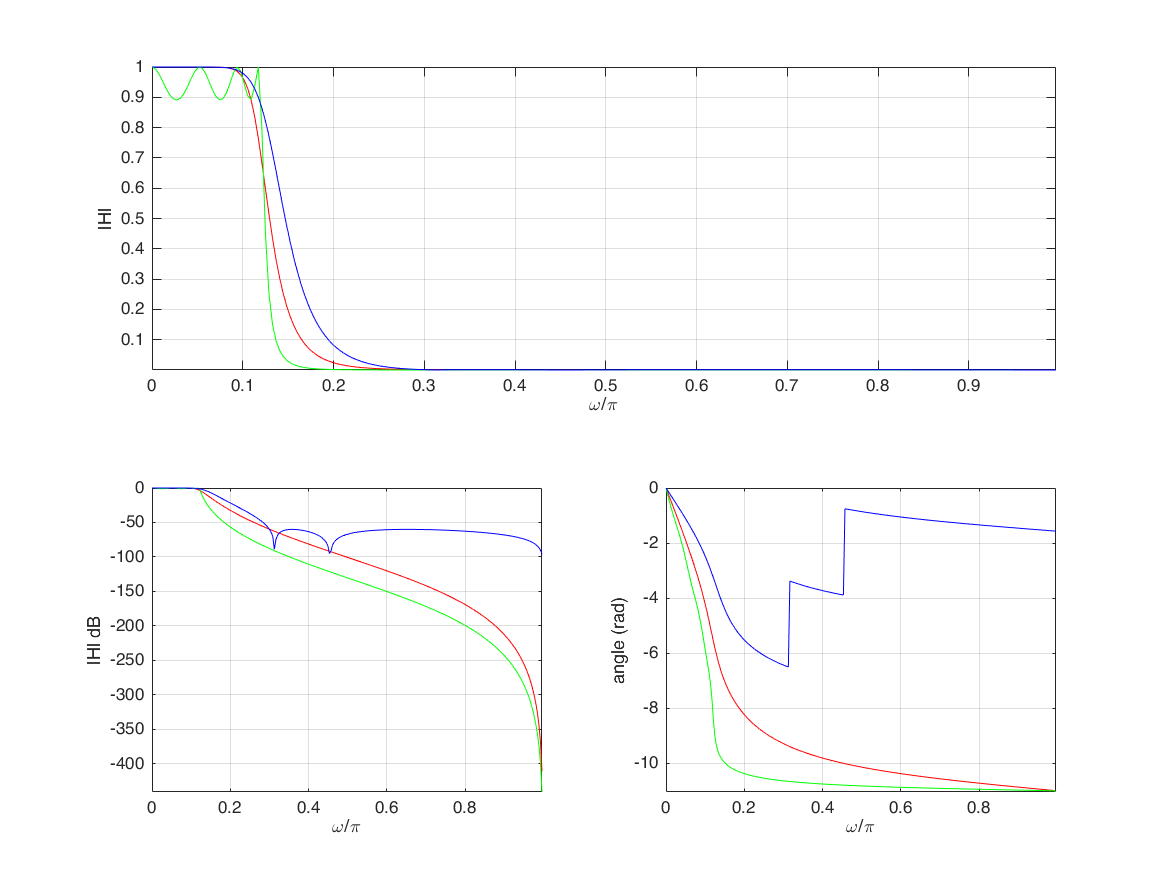
Chebyshev Type II
[b,a] = cheby2(5, 60, 0.3);
[H3,W] = freqz(b,a,256);

subplot(2,2,[1,2])
plot(W/pi,abs(H3),'b'); xlabel('\omega/\pi'); ylabel('|H|'); grid on; axis tight;
subplot(2,2,3)
plot(W/pi,20*log10(abs(H3)),'b'); xlabel('\omega/\pi'); ylabel('|H| dB'); grid on; axis tight;
subplot(2,2,4)
plot(W/pi, unwrap(angle(H3)),'b'); xlabel('\omega/\pi'); ylabel('angle (rad)'); grid on; axis tight;
Eliptic
[b,a] = ellip(4, 1, 60, 0.1);
[H4,W] = freqz(b,a,256);

subplot(2,2,[1,2])
plot(W/pi,abs(H4),'k'); xlabel('\omega/\pi'); ylabel('|H|'); grid on; axis tight;
subplot(2,2,3)
plot(W/pi,20*log10(abs(H4)),'k'); xlabel('\omega/\pi'); ylabel('|H| dB'); grid on; axis tight;
subplot(2,2,4)
plot(W/pi, unwrap(angle(H4)),'k'); xlabel('\omega/\pi'); ylabel('angle (rad)'); grid on; axis tight;
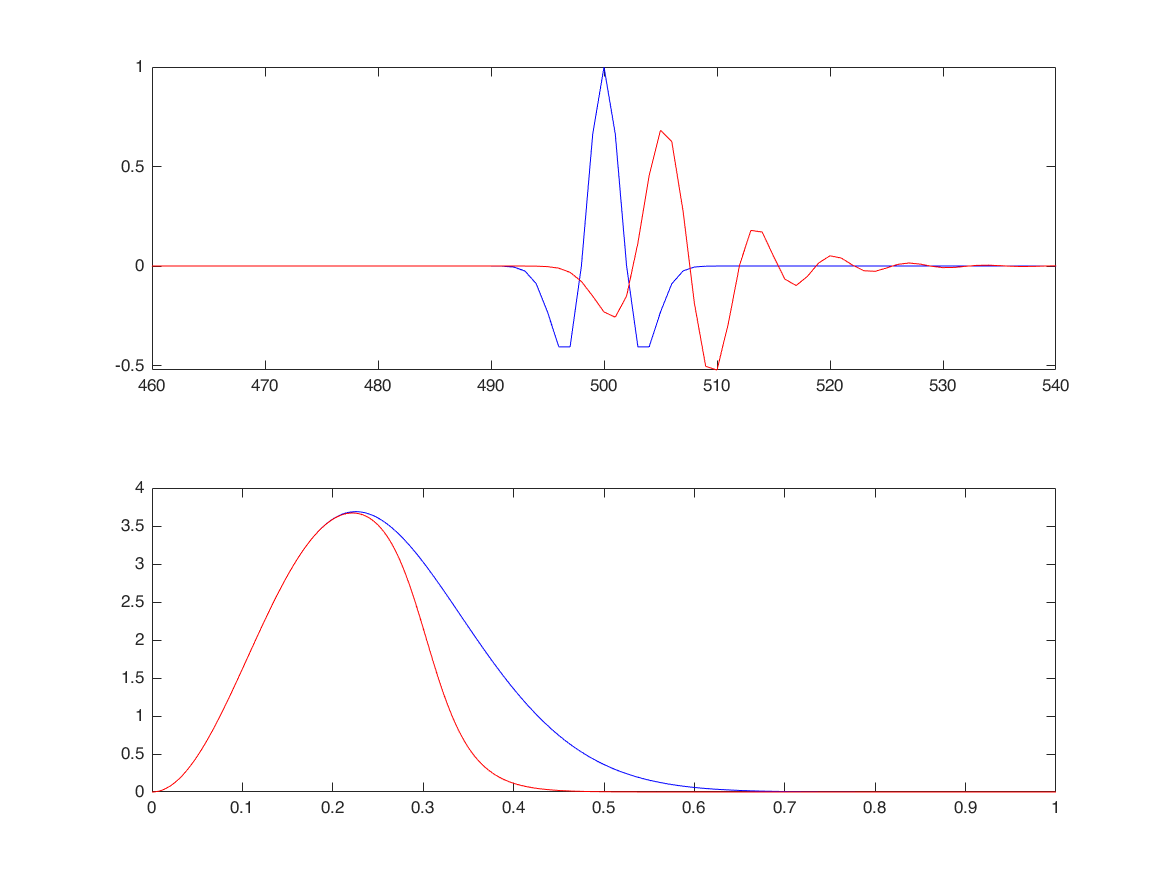
Use b,a coeffs to filter a signal with filter() function
nx = 0:1023;
x = (1-(nx-500).^2/4).*exp(-(nx-500).^2/2/4);

[b,a] = butter(7, 0.3);

y = filter(b,a,x);

figure
subplot(2,1,1)
plot(nx,x,'b'); axis tight; xlim([460,540]); hold on;
plot(nx,y,'r');

subplot(2,1,2);
sf = fft(x,1024);
plot(linspace(0,pi,length(sf)/2)/pi, ...
    abs(sf(1:length(sf)/2)), 'b'); hold on;
sf1 = fft(y,1024);
plot(linspace(0,pi,length(sf1)/2)/pi, ...
    abs(sf1(1:length(sf1)/2)), 'r');
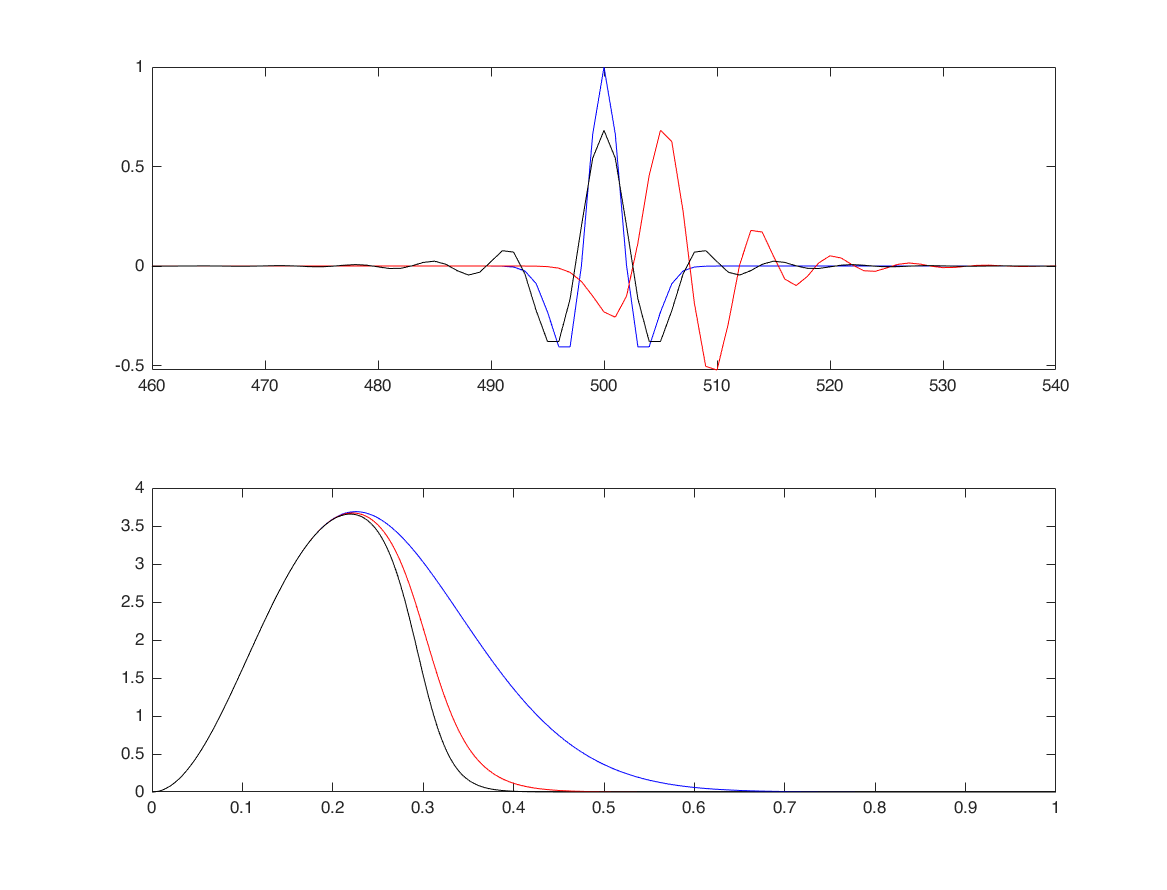
Use filtfilt to have zero-phase filter
% caution, amplitude is applied twice, but phase is cancelled out

y = filtfilt(b,a,x);

subplot(2,1,1)
plot(nx,y,'k');

subplot(2,1,2);
sf1 = fft(y,1024);
plot(linspace(0,pi,length(sf1)/2)/pi, ...
    abs(sf1(1:length(sf1)/2)), 'k');
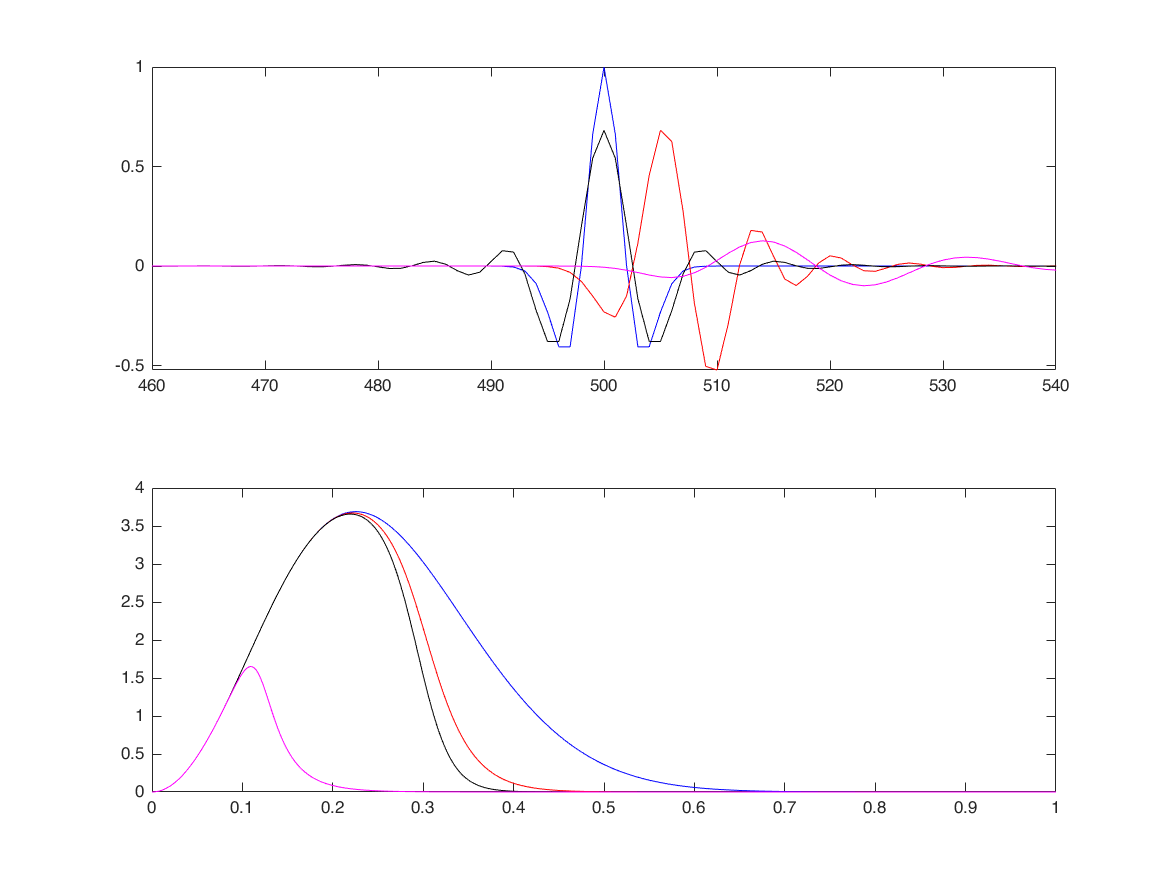
designfilt is the second way to use IIR filters
Fs = 2000; % sampling frequency -> Niquist-freq is Fs/2
Fp = 100; % Hz - passband corner
Fst = 300; % stopband frequency
Ap = 1.0; % dB - passband ripple amplitude
Ast = 60; % dB - stopband ripple amplitude

dbutter = designfilt('lowpassiir', ...
    'PassbandFrequency',Fp, ...
    'StopbandFrequency',Fst, ...
    'PassbandRipple',Ap, ...
    'StopbandAttenuation',Ast, ...
    'SampleRate',Fs, ...
    'DesignMethod','butter');
filtord(dbutter)
% fvtool(dbutter)

y = filter(dbutter,x);

subplot(2,1,1)
plot(nx,y,'m');
subplot(2,1,2);
sf1 = fft(y,1024);
plot(linspace(0,pi,length(sf1)/2)/pi, ...
    abs(sf1(1:length(sf1)/2)), 'm');
ans =

     7
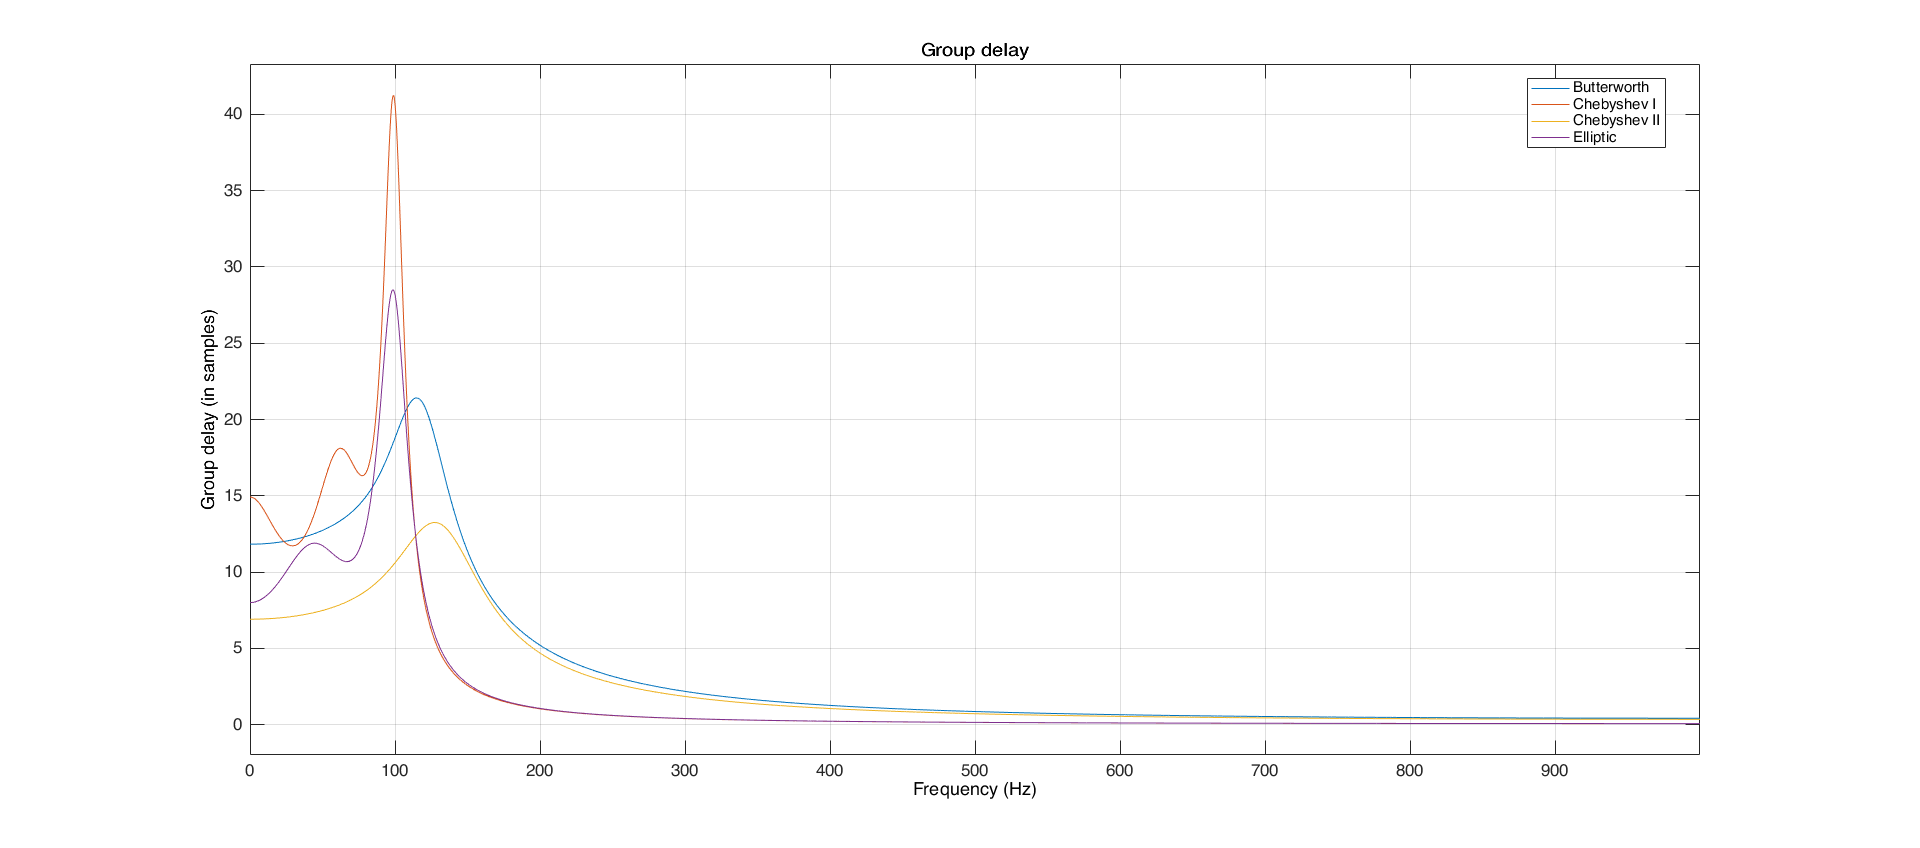
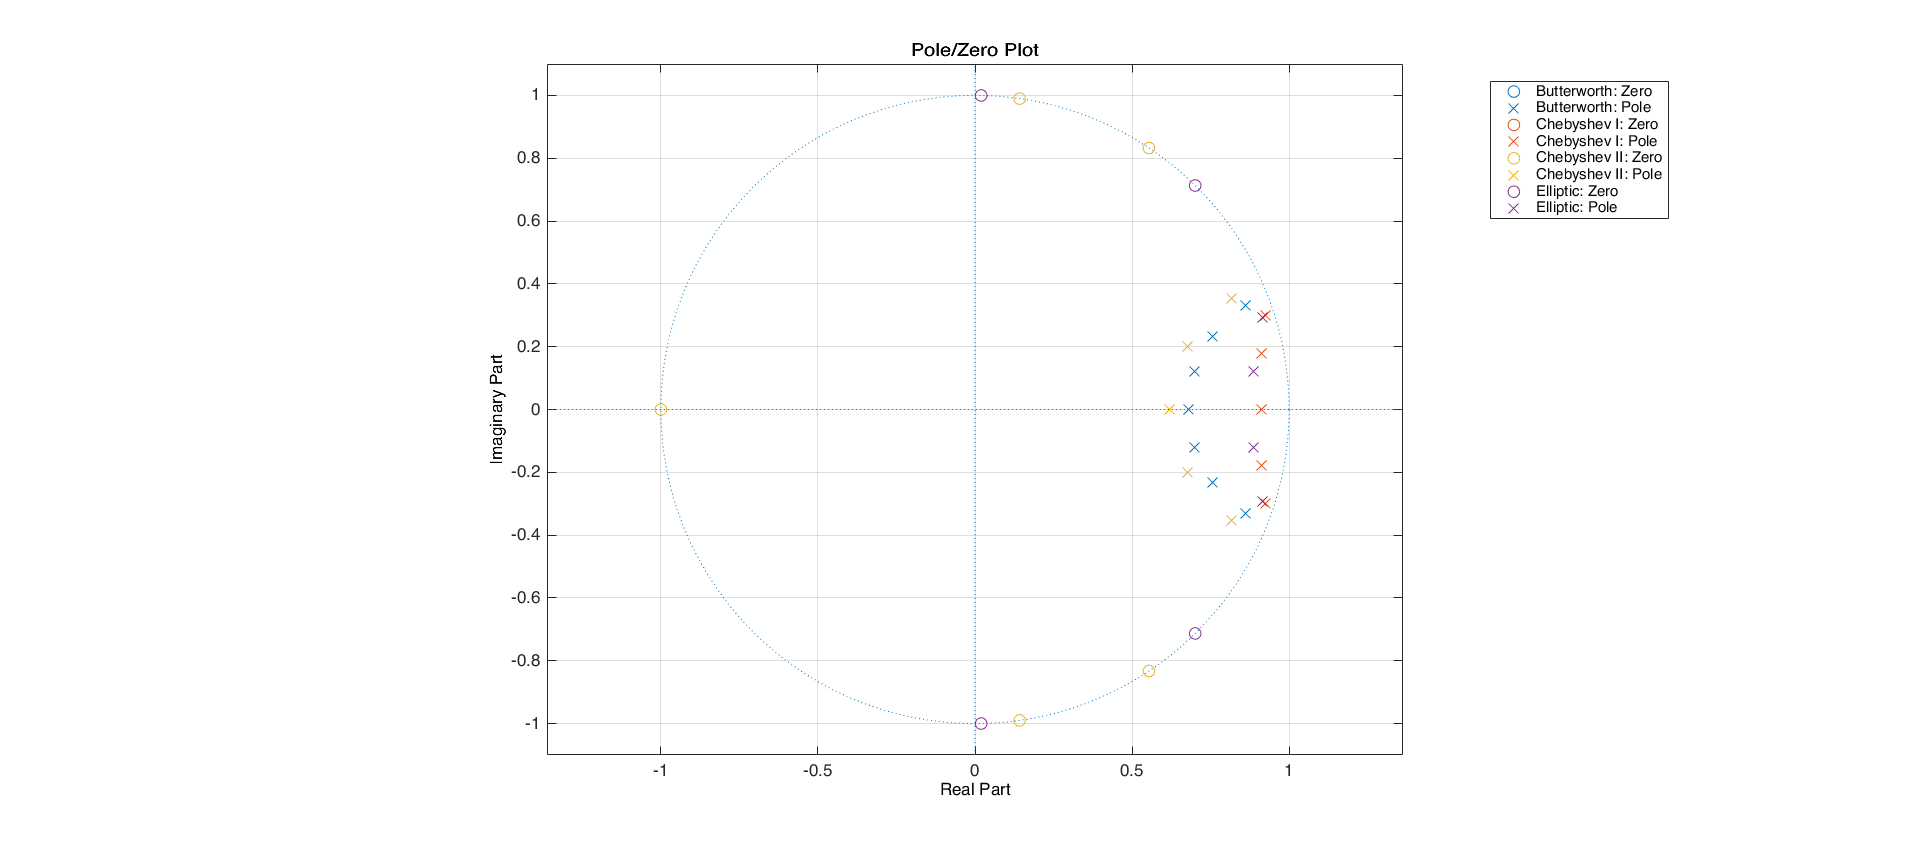
Fs = 2000; % sampling frequency -> Niquist-freq is Fs/2
Fp = 100; % Hz - passband corner
Fst = 300; % stopband frequency
Ap = 1.0; % dB - passband ripple amplitude
Ast = 60; % dB - stopband ripple amplitude

dbutter = designfilt('lowpassiir', ...
    'PassbandFrequency',Fp, ...
    'StopbandFrequency',Fst, ...
    'PassbandRipple',Ap, ...
    'StopbandAttenuation',Ast, ...
    'SampleRate',Fs, ...
    'DesignMethod','butter');

dcheby1 = designfilt('lowpassiir', ...
    'PassbandFrequency',Fp, ...
    'StopbandFrequency',Fst, ...
    'PassbandRipple',Ap, ...
    'StopbandAttenuation',Ast, ...
    'SampleRate',Fs, ...
    'DesignMethod','cheby1');

dcheby2 = designfilt('lowpassiir', ...
    'PassbandFrequency',Fp, ...
    'StopbandFrequency',Fst, ...
    'PassbandRipple',Ap, ...
    'StopbandAttenuation',Ast, ...
    'SampleRate',Fs, ...
    'DesignMethod','cheby2');

dellip = designfilt('lowpassiir', ...
    'PassbandFrequency',Fp, ...
    'StopbandFrequency',Fst, ...
    'PassbandRipple',Ap, ...
    'StopbandAttenuation',Ast, ...
    'SampleRate',Fs, ...
    'DesignMethod','ellip');

ford = [filtord(dbutter), filtord(dcheby1), filtord(dcheby2), filtord(dellip)];
figure; hfv = fvtool(dbutter, dcheby1, dcheby2, dellip, 'Analysis', 'grpdelay');
legend(hfv,'Butterworth','Chebyshev I', 'Chebyshev II', 'Elliptic');

figure; hfv = fvtool(dbutter, dcheby1, dcheby2, dellip, 'polezero');
legend(hfv,'Butterworth','Chebyshev I', 'Chebyshev II', 'Elliptic');